Week 7: Decision trees and deep neural networks
In this week I created visualization for decision trees and deep neural networks.
Decision tree
In the following I will write a very short summary about how this plots are made.
Reading data: TreeReader class
This class gets an xml file name and is able to read that. We can get the number of trees, and we can get a specified tree in a special object format. I choose the following format for storing tree data:
tree = {
  "info": {
    "IVar":  0,
    "Cut" :  0.5,
    "purity": 0.5,
    "pos":    "l"
  },
  children: [{
      "info": { ... }
      "children": [...]
    },{
      "info": {...}
      "children": [...]
    },
    ...
  ]
}
ipywidgets
Factory.DrawDecisionTree method will use TreeReader class to read xml file. Gets the number of trees and will create an input are using ipywidgets. Here we are able to choose the number of tree. After we press the button, ipywidgets will call a function, which will read that specified tree and converts to JSON string and writes a JavaScript code to notebook output cell, wich will call JsMVA.drawDecisionTree JavaScript function with JSON string. This function will call DecisionTree.draw JavaScript function.
DecisionTree.js
This is a very complicated library (419 lines and I worked more than 2 days on this). I use d3.js to create trees. d3.js has d3.layout.tree() object which will calculate positions for nodes and links. Drawing the tree with using this layout is a very easy task (I also use d3.svg.diagonal() function to create nice paths). Te hardness and complications comes in when we want to make amazingly interactive. I found an example about collapsing trees written by Mike Bostock (a core engineer of d3.js). It wasn’t easy to understand how it works, but after some time I was able to figure it out. After I understood that example, I started to create my own with rectangles. When I finished this, I added texts to nodes. I also added path highlighting, because in this way we can see nicely how we come to that node. Same way as in NeuralNetwork.js I added zooming, dragging and reseting option. Finally I thought about a very important new feature:
I thought when we hide a subtree we will have less nodes and more space, so it would be very nice if the nodes would become bigger and the text too. I worked a lot to get this working.
A summarize of features:
-
Mouseover (node, weight): showing decision path
-
Zooming and grab and move supported
-
Reset: double click
- Click on node:
- hiding children, if a node children are hidden the node will have a green border (lighter then path focusing green)
- rescaling all visible nodes: bigger nodes, bigger texts
- click again to show the subtree
- Left click on node (NEW): decision path nodes becomes bigger
Result
Here is a screen shoot running the new method in notebook:
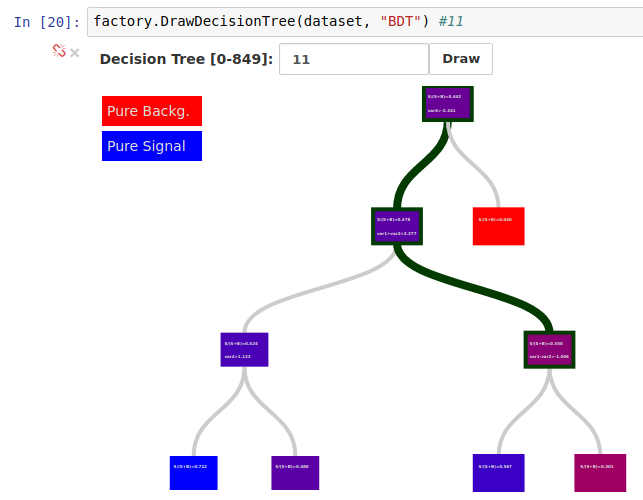
Here is the result copied from notebook (interactive):
Links
Compressing JavaScript
My JavaScript libraries become big, so I decided I will compress them. I use WebStorm for developing JavaScript codes, here I can use a file watcher, which will run a script every time source file changes. For compressing I decided I use UglifyJS library, I installed it with npm. I also added -mt extra parameter to UglifyJS call to I force changing variable names to more short ones. Minified source file sizes are almost the half of the original file’s.
Deep neural networks
I added new functionality to NeuralNetwork.js module, now it can draw deep nets too. You can see the results HERE: nbviewer, old dataset
After this I started testing, I added more layer, more neurons. But this doesn’t work. The problem is that with d3js we create svg elements and if we have more than 100000 svg elements in one page that will kill everything. I tested other javascript libraries and I found that the simple html5 canvas element will be good (it uses GPU acceleration). I tested this by drawing 10M rectangles, nothing bad happened, I had to wait a little, but it worked. After this, I created new methods in NeuralNetwork.js module, which uses the canvas object to draw a network.
To test the new functions and the canvas element I added 11 hidden layer, each layer contains 200 neurons, which means we have 430000 extra synapses. We have to wait a little but it will work: